Exam Support
Confidence in Handling Economic Data in Exam Papers
- Level:
- AS, A-Level
- Board:
- AQA, Edexcel, OCR, IB
Last updated 22 Mar 2021
This blog entry looks at some examples of exam questions that require you to show skills of application in handling economic data
Ahead of the exam, it is important to familiarise yourself with some macro and microeconomic data and be confident in understanding how the data is presented.
For example
- Is the data presented in real or nominal terms?
- Is the data expressed as a level or as a share of GDP?
- How long is the time period over which the data is shown?
- Have the charts or tables used any forecast information?
- Is the data expressed as an index number or in a specific currency?

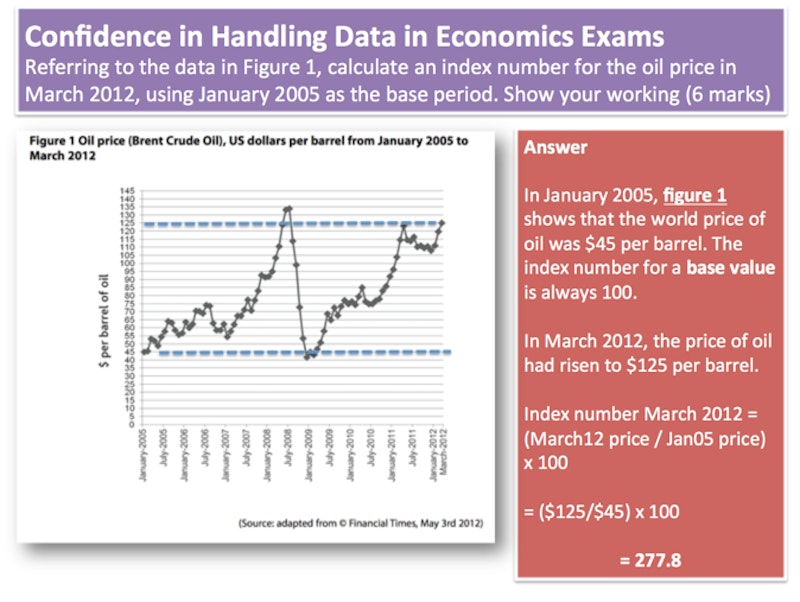
Calculating an index number from data contained within a chart
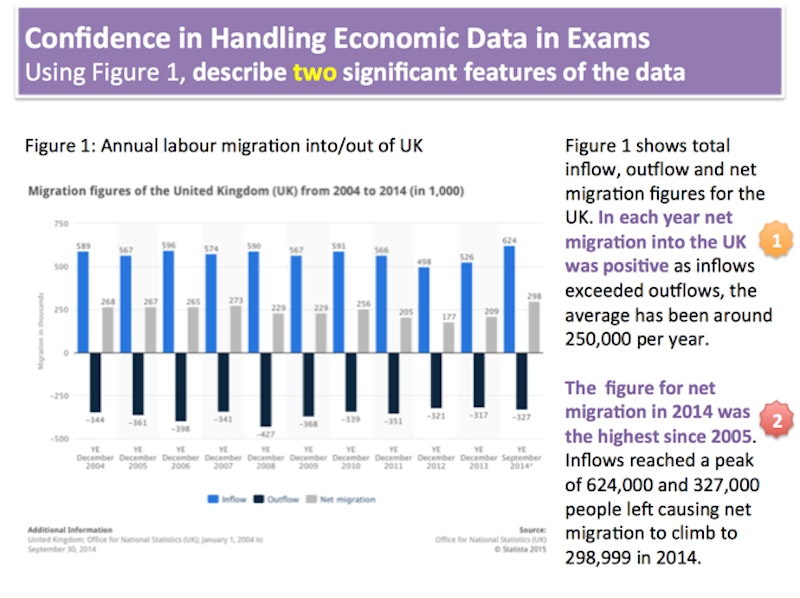
Describing two significant features of data contained within a chart
With reference to the information provided ....
It is is really important in exams to make clear reference to the data and key points contained in figures an extracts - this is an important skill in the data response paper. Here is an example showing declining rates of tobacco smoking in the UK.
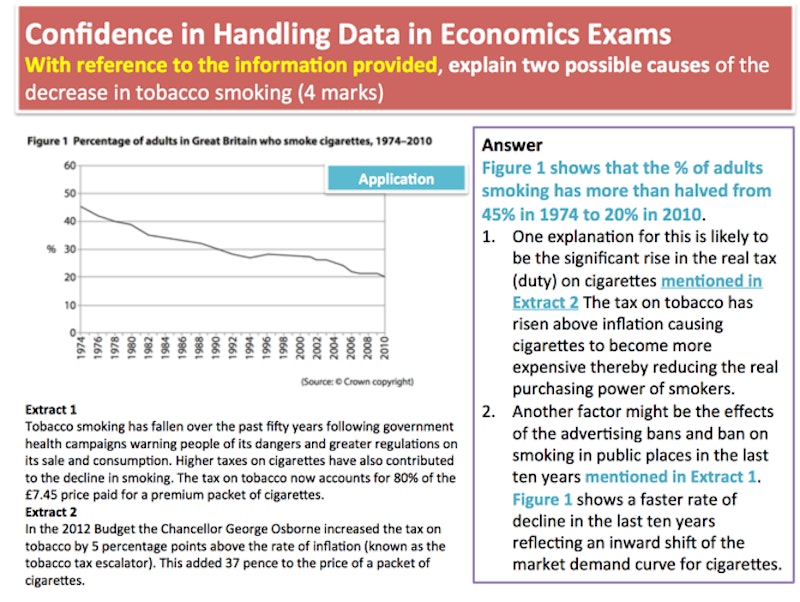
Higher order data application - one higher order skill is to combine two or more features from the data for higher level application.
You might also like
Globalisation - Evaluating Benefits and Costs
Exam Support
AQA A Level Economics Exam Advice
Exam Support
Import Tariffs (Essay Technique Video)
Exam Support
Essay on Advertising and Economic Welfare
Exam Support
Edexcel Paper 3 for 2019 – Synoptic Economics
Exam Support