In the News
Inequality in the UK

11th January 2017
Jeremy Corbyn announced in an interview on Tuesday that inequality in the UK has been getting worse. He is both right and wrong - because your take on inequality depends on which data you use.
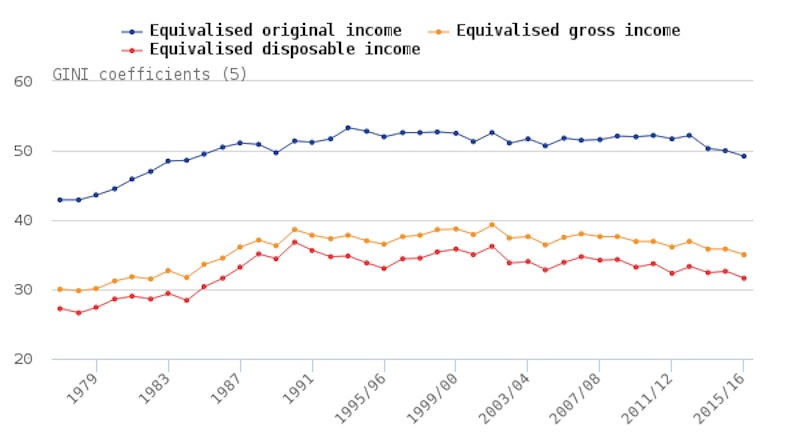
The ONS released their annual statistics on inequality earlier this week, which show a decline in the UK's Gini coefficient - the chart below is taken from their report.
However, careful reading of this BBC report suggests that if we look at income after housing costs, then inequality has worsened. Furthermore, if we treat the data on income in a more granular way, we can see that the richest 0.1% have become considerably richer.
We could also look at inequality in terms of wealth, rather than income. The latest data available for the UK is from 2014 (another useful evaluation point!). It tells us that the wealthiest 10% of UK households own 45% of the UK's wealth compared with just 9% of wealth for the least-wealthy 10%. Households in the South East are the wealthiest, and across the UK, half of households have wealth of at least £225,100.
- Economics
- Blog
- In the News
- Gini coefficient
- Economic Inequality
- Income
- Disposable income
- Household wealth
Ruth Tarrant
Ruth has been Subject Lead in Economics at tutor2u for many years after a career of teaching Economics, Business, Politics and Maths in a range of secondary schools. She is a highly experienced A level Economics Examiner, and also teaches undergraduate Economics on a very part-time basis at the University of Oxford. Ruth is passionate about making economics fun, engaging and accessible.
You might also like

OECD Overview of the UK Economy (2015)
5th April 2015
China's huge changes
21st September 2015
How does the 1% live?
9th March 2016

Social Mobility - to intervene or not to intervene....
26th July 2016
UK workers suffer biggest hit to real wages since records began
17th August 2022

Fixing inequality and insecurity in the USA
8th October 2022
Does the UK need a wealth tax on millionaires and billionaires?
17th January 2023