Study Notes
Market Equilibrium - Transition to New Equilibrium
- Level:
- GCSE, AS, A-Level
- Board:
- AQA, Edexcel, OCR, IB
Last updated 22 Mar 2021
When there is a change in either supply and/or demand, it can take some time for a market to move towards a new equilibrium position. Not every market clears immediately.

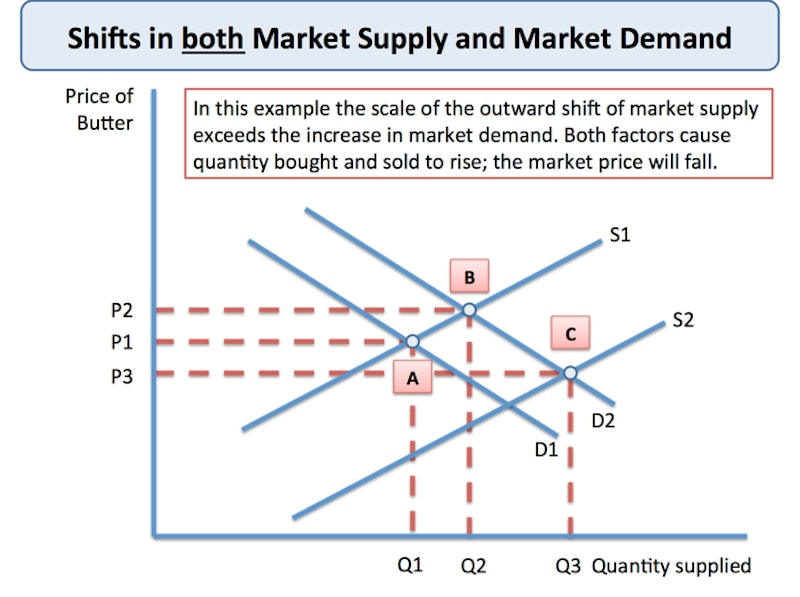
In many cases we see shifts in both demand and supply - in which case the final effect on price and quantity depends on the direction of the shifts in the curves and also the scale of the changes. Here is an example in the analysis diagram below.
Diagrams are a simplification of reality!
- We tend to use supply and demand diagrams to illustrate movements in market prices and quantities – this is known as comparative static analysis
- The reality in most markets and industries is more complex. For a start, many businesses have imperfect knowledge about their demand curves – they do not know precisely how consumer demand reacts to changes in price or the true level of demand at each and every price
- Likewise, constructing accurate supply curves requires detailed information on production costs and these may not be readily available.
You might also like
Joint Supply
Study Notes
Aggregate Demand and Aggregate Supply
Topic Videos

Will oil prices rise in 2016?
27th December 2015

Economics of crime and punishment
21st September 2016
Fiscal Policy - The Laffer Curve
Study Notes
Supply Theory (Quizlet Revision Activity)
Quizzes & Activities
1.2.4 Theory of Supply (Edexcel A-Level Economics Teaching PowerPoint)
Teaching PowerPoints