Study Notes
Explaining the relationship between average and marginal revenue
- Level:
- AS, A-Level, IB
- Board:
- AQA, Edexcel, OCR, IB, Eduqas, WJEC
Last updated 4 Sept 2023
To illustrate the relationship between average revenue (AR) and marginal revenue (MR), let's create a simple numerical example in a table. We'll assume a hypothetical firm operating in a perfectly competitive market, where it can sell its product at a constant price.
Let's assume this firm sells widgets and faces a constant market price of $10 per widget. We'll calculate the AR and MR for different levels of output:
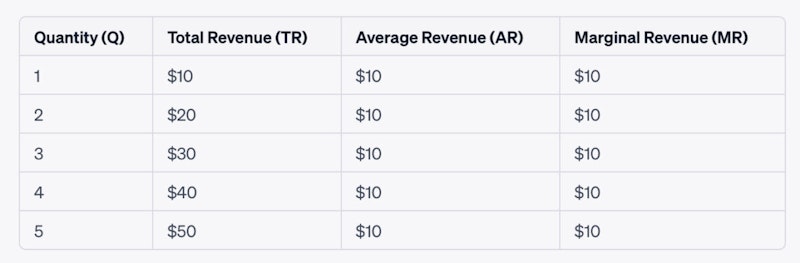
In this example:
- Quantity (Q): This column represents the quantity of widgets produced and sold.
- Total Revenue (TR): Total revenue is calculated by multiplying the quantity sold (Q) by the market price ($10 per widget). TR = Q * Price.
- Average Revenue (AR): Average revenue is calculated by dividing total revenue (TR) by the quantity sold (Q). AR = TR / Q. In a perfectly competitive market, AR is equal to the market price because the firm can sell any quantity at the same price.
- Marginal Revenue (MR): Marginal revenue represents the additional revenue a firm earns by producing and selling one more unit. It's the change in total revenue when output increases by one unit. In this example, because the market price is constant at $10, MR is also $10 for each additional unit sold.
Notice that in a perfectly competitive market with a constant market price, both AR and MR are equal to the market price. This is a unique feature of perfect competition. The firm can sell any quantity of its product at the same price, so there is no need to reduce the price to sell more units (as there would be in a monopolistic or imperfectly competitive market).
Marginal revenue when average revenue is falling
Here's an example where average revenue (AR) falls as the quantity sold increases. This is a common scenario in markets with downward-sloping demand curves, such as monopolistic or imperfectly competitive markets:

In this example:
- Quantity (Q): This column represents the quantity of smartphones produced and sold.
- Total Revenue (TR): Total revenue is calculated by multiplying the quantity sold (Q) by the price at which each unit is sold. The prices are determined by the market demand curve.
- Average Revenue (AR): Average revenue is calculated by dividing total revenue (TR) by the quantity sold (Q). AR = TR / Q.
- Marginal Revenue (MR): Marginal revenue represents the additional revenue a firm earns by producing and selling one more unit. It's the change in total revenue when output increases by one unit.
In this scenario, as the firm increases its quantity sold, the average revenue falls. This is indicative of a downward-sloping demand curve. In markets with such demand curves, consumers are typically willing to pay a lower price for additional units of a good, which results in declining average revenue as the firm produces and sells more units. Marginal revenue also decreases because selling one more unit requires reducing the price for all units sold, leading to smaller incremental gains in total revenue.
You might also like
Explaining Business Objectives
Study Notes

GoPro's revenue growth is slowing as rivals enter the market
3rd February 2016
Test 15: A Level Economics: MCQ Revision on Business Objectives
Practice Exam Questions
Marginal decisions in economics
Study Notes
Business Objectives: Sales Revenue Maximisation
Topic Videos

In Economics - what is thinking at the margin?
2nd August 2023