Study Notes
Correlation
- Level:
- AS, A-Level
- Board:
- AQA, Edexcel, OCR, IB
Last updated 22 Mar 2021
Correlation is another method of sales forecasting. Correlation looks at the strength of a relationship between two variables.
For marketing, it might be useful to know that there is a predictable relationship between sales and factors such as advertising, weather, consumer income etc.
Correlation is usually measured by using a scatter diagram, on which data points are plotted. For example, a data point might measure the number of customer enquiries that are generated per week (x-axis) against the amount spent on advertising (y-axis). This is illustrated below:
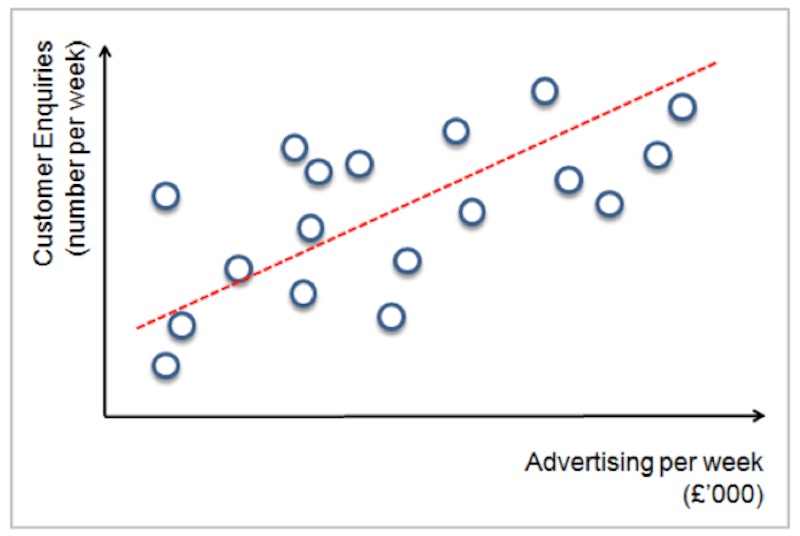
It is normal convention to show the:
- Independent variable (the factor that causes the other variable to change) on the x-axis
- Dependent variable (the variable being influenced by the independent variable) on the y-axis
How can a marketing manager make sense and use of all the data points once they have been plotted on the scatter diagram?
The answer is a "line of best fit" (the regression line) which attempts to plot the mathematical relationship between the variables based on the data points. This can be drawn by hand or using an Excel spreadsheet or specialist marketing software.
There are three kinds of possible correlation:
Positive correlation: A positive relationship exists where as the independent variable increases in value, so does the dependent variable
Negative correlation: A negative relationship exists where as the independent variable increases in value, the dependent variable falls in value
No correlation: There is no discernible relationship between the independent and dependent variable
The line of best fit indicates the strength of the correlation.
Strong correlation means that there is little room between the data points and the line.
Weak correlation means that the data points are spread quite wide and far away from the line of best fit.
If the data suggests strong correlation, then the relationship might be used to make marketing predictions.
The big danger with correlation is of believing there is really a causal link between two variables when, in fact, they are not related.
It is logical to believe that there is a causal link between the daily temperature and sales by ice-cream vans.
However, is there a link between increasing childhood obesity and increasing disposal incomes for households? Both these variables have risen over the long-term, but they are probably not directly related.
You might also like
Test Marketing
Study Notes
Income Elasticity of Demand
Quizzes & Activities
Master Pan sales cook on gas after Tom Daley's Instagram post
7th January 2016
Sensitivity Analysis
Topic Videos
Data Mining
Topic Videos
Scientific Decision Making
Topic Videos