In the News
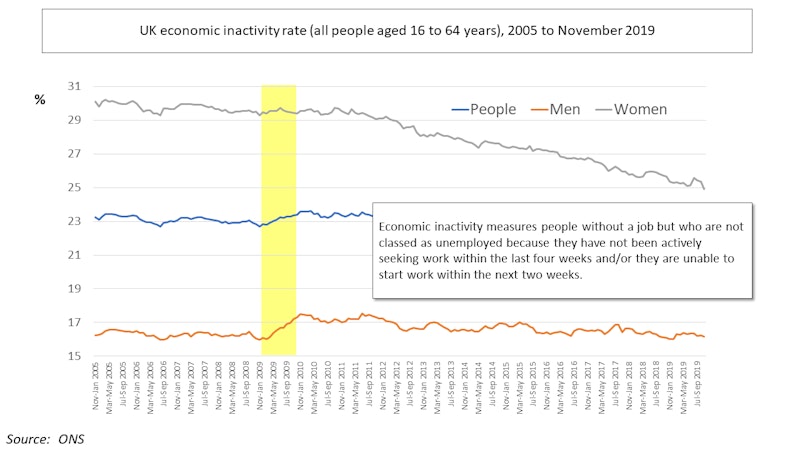
UK Economic Inactivity - chart showing trend over the last 15 years

24th February 2020
If you're looking for a discussion topic for returning Economics students over the next few days then try using the chart below on economic inactivity in the UK (2005-2019).
Economic inactivity as a topic reared its head over the last couple of weeks as Home Secretary Priti Patel suggested that this group of people could be used to solve the problem of a lack of available labour in the UK as the country's immigration control becomes tighter. Patel showcased new measures that will place greater restrictions on potential immigration, particular those looking to take up low-skilled work.
ONS statistics suggest that approximately 8.5 million people are economically inactive in the UK. About 27% of that figure are students, 26% are too ill to work and about 13% have retired early.
The chart shows the trend in economic activity in 3 categories - for women, for men and for the population as a total.
Questions for students:
- Compare the UK trend in economic inactivity rates for women and men over the 2005 and 2019 period
- What could have caused the differences in the trends for women and men over that 15 year period?
- What could have caused the apparent spike in inactivity as highlighted by the yellow shading on the chart (2009)?
This chart is available to download as a Powerpoint file here and as a PDF file here.
- Economics
- Blog
- In the News
- Economically inactive
- Economically inactive population
- Labour market failure
- Points-based immigration
Jonny Clark
Jon Clark has been teaching economics and business studies for over 25 years primarily in the Further Education sector. Before joining tutor2u, he was a senior manager at South Cheshire College in Crewe.
You might also like
What is Full Employment?
Topic Videos
Labour Market Failure (Labour Markets)
Topic Videos

Economics of the Gig Economy
11th July 2017
Labour Market Enforcement Tsar Starts Work
27th July 2017
Economic Inactivity (Labour Markets)
Study Notes