In the News
Falling car sales
5th January 2018
The fall in sales of new cars, following six years of sales growth, is widely reported today. This BBC article which offers six charts illustrating possible reasons for the decline is useful for analysis, and students could use it to practise Graham's classic BLT method - This is Because - Leadingto - Therefore.
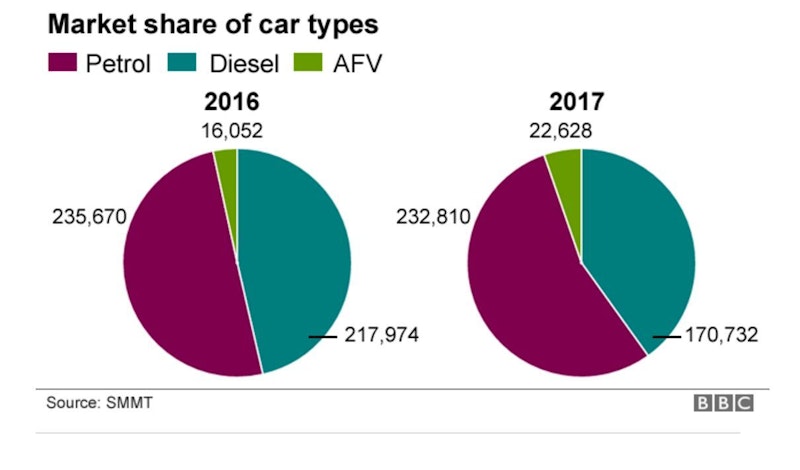
I also particularly like this chart, as the basis for practising calculation of percentage change - try printing it out to give students before they read the rest of the article, and then discussing the different significance of a 21.7% fall in sales of diesel cars, amounting to over 47,000 vehicles, compared to a 41% rise in sales of alternatively fuelled cars, amounting to only 5,500 vehicles.
You might also like
Analysing Marketing Data (Revision Presentation)
Teaching PowerPoints
Test Marketing
Study Notes
Moving Averages and Extrapolation
Study Notes

The Continued Decline of Album Sales
24th January 2016

The Vinyl Countdown!
16th April 2016
Porter's Five Forces Model
Teaching PowerPoints
Business Maths - Calculating Percentage Changes
Topic Videos
Scientific Decision Making
Topic Videos