Study Notes
Flood hydrographs explained
- Level:
- AS, A-Level
- Board:
- AQA, Edexcel, OCR, IB, Eduqas, WJEC
Last updated 22 Mar 2021
What are flood hydrographs? This study note explains them.
Flood hydrographs are graphs that show how a drainage basin responds to a period of rainfall.
They are used to plan for flood situations and times of drought. They show the river discharge that occurs as a result of precipitation from an earlier storm.
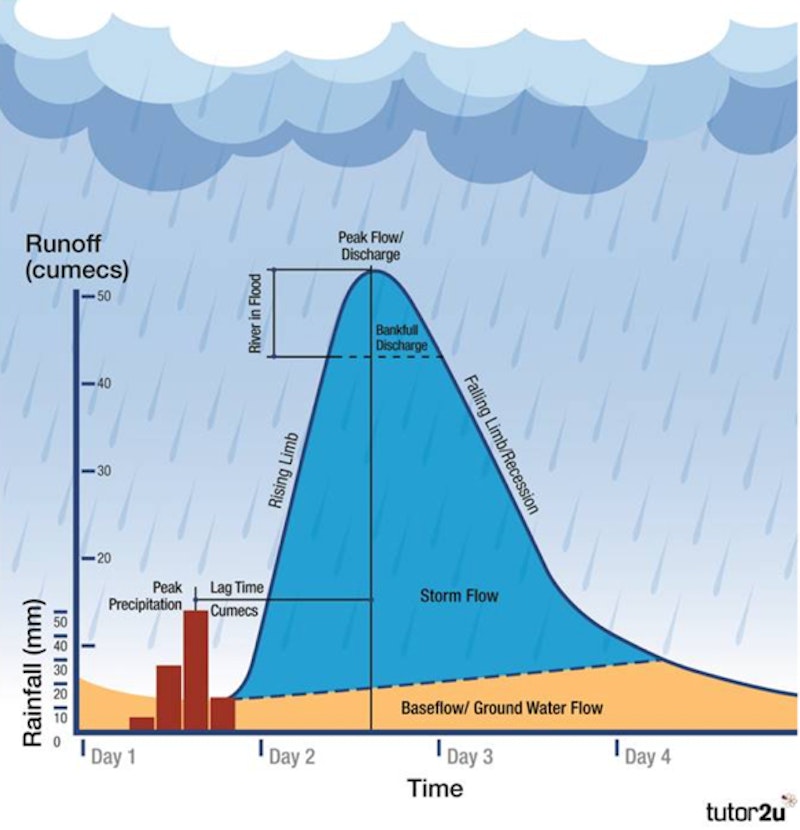
Key terms on the hydrograph, illustrated below, are:
- Peak rainfall – time of the highest rainfall level.
- Peak discharge – time of the highest river channel level.
- Lag time – difference in time between the peak rainfall and peak discharge.
- Rising limb – the increase in river discharge.
- Falling limb – the fall in river discharge.
- Base flow – normal river level.
You might also like
Water Cycle - A-Level MCQ Quiz
Quizzes & Activities
Drainage Basin Stores
Study Notes