In the News
Visualising Climate Change Made Easy: Stripes, Scarves and Home-spun Data

31st August 2022
What resources can teachers use to help students get to grips with anthropogenic climate change?
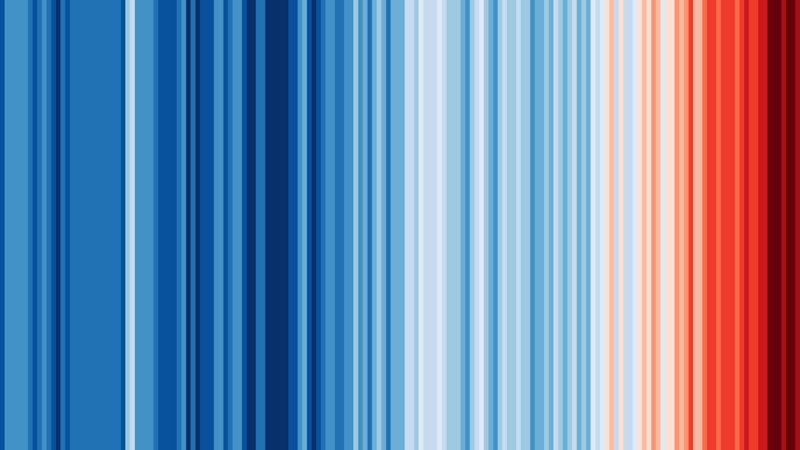
For students who took the long, post-GCSE summer ‘off’ Geography, #ShowYourStripes is a great conversation starter. Getting a reaction to this image will help you establish what students know and understand about global heating. Better still, it makes the science pretty clear.

Using this interactive website, students can find out about temperature trends over the last 150 years by creating colourful and descriptive, stripey graphical story. Delightfully (for the geographer), you can choose which region, country or even UK city you want to focus the graph on. If you prefer, you can choose to display the data as a divergent bar graph instead of what looks, for all the world, like a Channel 4 News Jon Snow tie. Colours used in the data visualisation are designed to ensure those who are colour-blind can also see the trends. These stripes have even been adopted by Reading FC, featuring on their home strip for 2022-23.

Interestingly, the award-winning 'Warming Stripes' approach to explaining the climate crisis may have started life as a crocheted blanket, or a scarf. Prior to the University of Reading, Ed Hawkins' inspired illustration of climate data, a physicist also from Reading, Ellie Highwood, created a stripey ‘global warming blanket’ depicting temperature anomalies since 1850. Read her blogpost here. And before that Georgian scientist Joan Sheldon made a 'globally warm scarf' using blue, red and purple rows.
It is (deceptively) simple images like these that help build students' understanding of the 'golden thread' of anthropogenic climate change that runs through A Level Geography. Your discussion might lead onto other key themes at key stage 5, including mitigation, adaptation, causality and systems.
Of course, making sense of geographical data is itself an important 'life hack' for A Level geographers. The change in annual temperatures displayed in the warming stripes graphic begins in the 19th Century and shows whether each year was warmer (reds) or colder (blues) than the average temperature for the period 1971-2000. It displays anomalies and therefore is not so simple, perhaps, as it first appears.
Might Year 13 benefit from un-picking why some data visualisations are better than others, as they contemplate writing up their Independent Investigation. Why not start with the stripes?
You might also like

Climate Change by Numbers
1st March 2015

Top Gear low emissions
10th March 2015

Carbon dioxide time lapse
12th March 2015

10 Best Geography Movies for the Holidays Part 1: Movies 10 to 6
7th August 2015

Unsustainable growth degrades Asia's land
8th October 2015

The Predicted Impact of Climate Change
14th November 2015

The Front Line of Climate Change - Fiji's Sinking Villages
26th November 2015

Is Paris The Final Chance to Address Climate Change?
26th November 2015