Topic updates
GIS for the NEA: A Quick Start Guide for the Confused!

12th July 2023
For many teachers and students the NEA feels like a natural place to start using GIS. The ability to efficiently collect, present and analyse spatial data is of huge importance to a successful enquiry – and GIS should make this easy! But where to start? If you haven't used GIS before, it’s a high-stakes arena to start grappling with different tools and data-sets. Time pressure can make an explorative, playful, 'see-what-works' approach, recommended elsewhere, feel inappropriate.
Step one: Start with the secondary data
It may seem counterintuitive, but we wholeheartedly recommend starting your GIS journey with secondary data. There is a wealth of extremely simple, free, GIS tools that you can use to explore different topic areas. Their simplicity allows a new user get to grips with using GIS without feeling overwhelmed. The rich data they make accessible enables students to refine and contextualise their enquiry questions – turning what could be a dull re-tread of a known case-study into a genuine contribution to the geographical canon. Access to this data will also help to facilitate better planning and sampling strategies - helping students towards higher marks in their NEA.
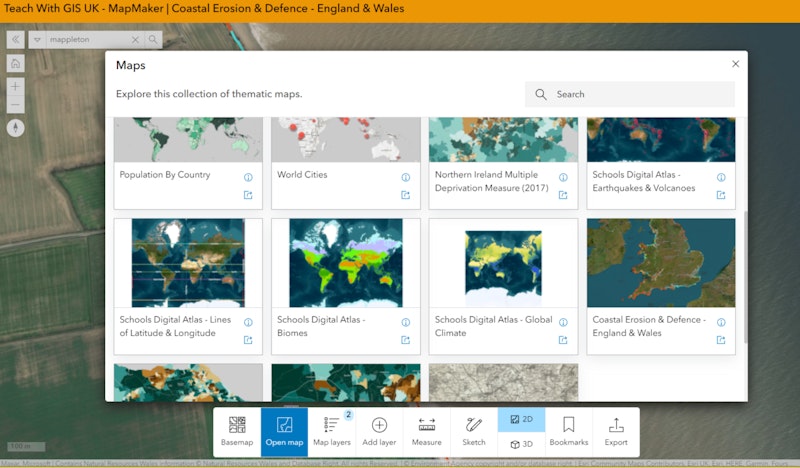
Engaging with secondary data is as simple as using MapMaker to characterise a case study area. In this example, a student can quickly and easily locate and characterise their area of interest using different basemaps.

They can then examine the different coastal management strategies in place and how these manifest in terms of actual coastal defences. By adding in Environment Agency data that is straightforward to find, and using a simple swipe tool they can switch between the Shoreline Management Plan (SMP) policy and defence type in this location.
They can then apply a simple, button-click tool to explore this digital twin of their site before they test for real in the field: in this case using the elevation profile to look at the difference in sediment height either side of a groyne.
Mapmaker can explore the subjective as well as the quantitative. Are students interested in how perceptions of place are affected by the weather? Clicking the weather button allows them to simulate conditions across the year. A great resource to use with a focus group!
Or perhaps they are investigating at an urban context, examining how gentrification impacts on different groups of people. Using the 3D topographic basemap and clicking the daylight button makes light-theft by rising skyscrapers, or the impact of tree cover on shade, very easy to measure.
You can find MapMaker and a collection of other data tools on the Teach With GIS fieldwork page here.
Step two: Off the shelf data collection
Using a mobile device to collect data is an enormous time-saver when it comes to transcribing, presenting and analysing it. There are quick and easy ways to set up data-capture forms for any question students devise. But if you’re using some of the most common techniques, like environmental quality surveys, traffic and pedestrian counts, or microclimate observations, there are now free off-the-shelf tools to make it even more straightforward. Scan a QR code to open a survey and start entering data immediately. You can then view collected data on a ready-made dashboard, download a copy into a spreadsheet for your own statistical analysis, and even take it back into ArcGIS Online to re-map in your own way.

Step three: community resources
Once students have collected their data, whether it was using a mobile app or pencil and paper, there are step-by-step tutorials available to help them map and analyse it. The Esri UK schools team also broadcast student-focused webinars to introduce basic cartographic and analytic techniques, helping them avoid common pitfalls and the 'GIS defaults' (like orange proportional symbols!) that have started to attract criticism in examiners’ reports.
The community of GIS-enabled geography teachers is friendly and growing fast. We welcome you to connect with us and make use of what is already available - before you and your students re-invent the wheel!
Katie Hall
50% of the Esri UK Schools Team, Katie is a former geography teacher and archaeologist. They work to make GIS accessible to all, and showcase the amazing career opportunities in the geospatial sector.
You might also like


40 Maps That Explain the World
3rd February 2016
What Makes a Good Map?
21st January 2016

National Map Week
16th October 2017

Swiss cities by population
24th October 2017

Get Outside - it’s National Fieldwork Fortnight!
28th June 2023