Study Notes
Interquartile Range (IQR)
- Level:
- AS, A-Level
- Board:
- AQA, Edexcel, OCR, IB
Last updated 22 Mar 2021
The interquartile range (QR) is a measure of ‘spread’ in a collection of data. It is one of a number of ‘measures of dispersion’.
How is the Interquartile Range helpful?
When we need to describe data collected from an area to compare with data from another area, we may use some sort of ‘average’ to summarise it. We may use, for example, the ‘mean’ pebble size we have measured on a beach to compare with the ‘mean’ of another beach. But this can give an inaccurate interpetation if we then assume the pebbles on the two beaches are similar; the ‘spread’ of pebbles on one beach, from very small to very large may, in fact, be quite different from another beach where the pebble sizes are all very close to the ‘mean’.
What is the Interquartile Range?
This statistical measure uses the concept of the ‘median’ rather than the mean – the middle-ranking value in a range of data ranked from largest to smallest. It then finds the median of the upper half (Upper Quartile) and subtracts the median of the lower half (Lower Quartile) to produce the difference between the quarter and three-quarters value – known as the Interquartile Range. This gives an indication of the ‘spread’ of the data either side of the median.
How is the Interquartile Range calculated?
It can be calculated manually by counting out the ‘half-way’ point (median), and then the ‘halfway point of the upper half (UQ) and the halfway point of the lower half (LQ) and subtracting the LQ value from the UQ value:
Imagine we measured 11 pebbles taken from a beach in cm:
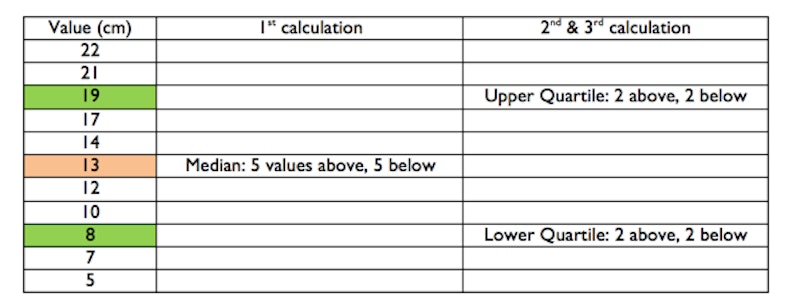
4th calculation: Interquartile Range
= UQ – LQ
= 19 – 8
IQR = 11
Interpretation: There are 11cm between the size of pebbles at the quarter, and three-quarters dispersion around the median pebble size on this beach.
- It can be calculated using three simple formulas. These identify the place in the ranking of values where you can locate the median, UQ and LQ values.
For the median: (n + 1) ÷ 2
For the UQ (n + 1) ÷ 4
For the LQ 3(n+1) ÷ 4
where ‘n’ is the number of values in the data set
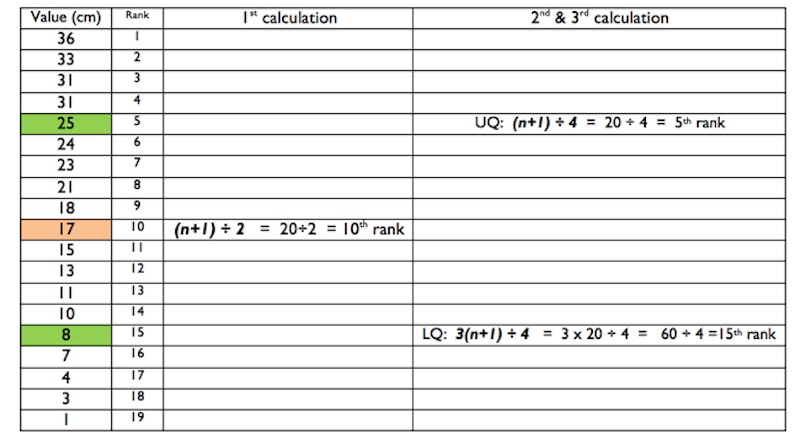
4th calculation:
UQ – LQ (remember to subtract the ‘values’ not the ‘rank’)
= 25 – 8
IQR = 17 cm
Uses of the Interquartile Range
Interquartile Range is most useful when comparing two of more data sets. For example, you may have collected pebble sizes from a number of beaches along a coast. Whilst they may have a similar ‘median’ pebble size, you may notice that one beach has much reduced ‘spread’ of pebble sizes as it has a smaller Interquartile Range than the other beaches. You may then want to focus your fieldwork on this beach to try to work out the processes causing this anomaly to occur.
Related statistical measures
Standard Deviation is also a measure of dispersion, but it uses the ‘mean’ rather than ‘median’ as its standard from which the average variation (or ‘deviation’) of all the other values are measured.
You might also like
Mean, Median and Mode
Study Notes

A-level Geography: Quantitative Skills Halloween Quiz
9th October 2023