Study Notes
Measures of Disperson
- Level:
- AS, A-Level
- Board:
- AQA, Edexcel, OCR, IB
Last updated 22 Mar 2021
Measures of dispersion give you an indication of the spread of your data; the range and standard deviation are two key examples.
Range
The range is the difference between your highest and lowest values. It is simple to calculate, however it does not take central values of a data set into account, and so it can be skewed by extremely high or low values.
Standard Deviation
The standard deviation is a measure which shows to what extent the values in a data set deviate from the mean. It is calculated using all of the values, and so is arguably more representative than the range.
Standard deviation is calculated using the formula below:

For each value in the data set (x), subtract the mean (x̄), and then square the result. Then find the sum of all the resulting values. Next, this sum is divided by the number of values in the data set (N), then the square root of the resulting number is found.
For example, take the data set (2, 2, 4, 5, 32)
The mean
(x̄) is:

Now we subtract the mean from each value in the data set:

Then square the results:

Next, find the sum of the squared values:

Divide this by the number of values (N), which in this case is 5:

Finally, we find the square root of the result:

The standard deviation of this data set is therefore 11.56.
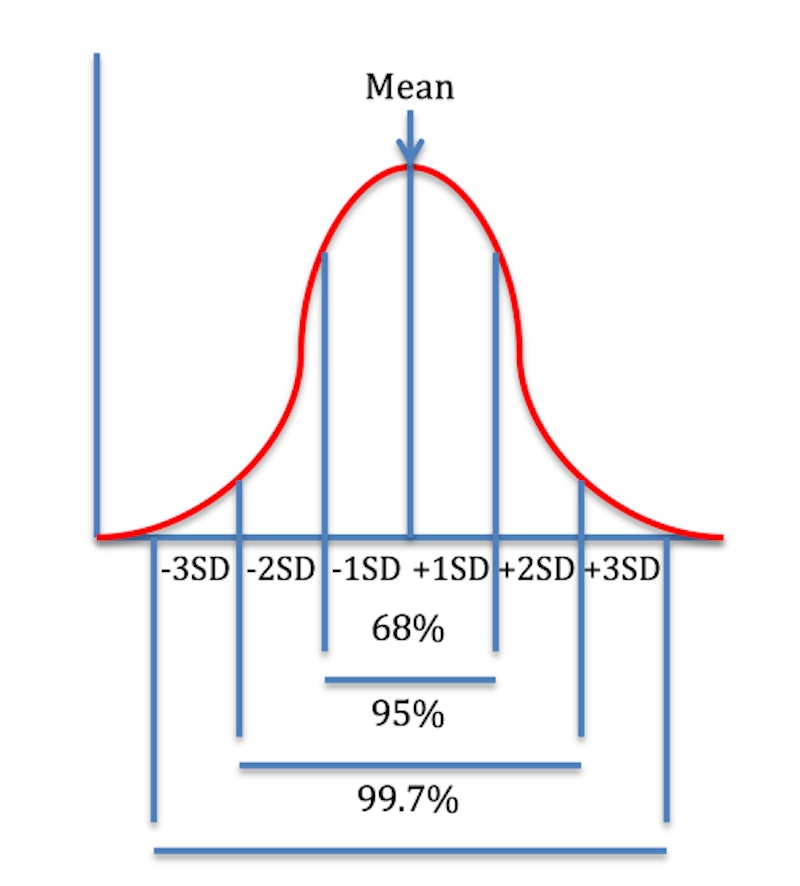
Unlike the range (using only the highest and lowest values), the full data set is used to calculate standard deviation, so more data is taken into account. It can also allow relatively accurate analysis in relation to the mean; roughly 68% of the values in a normally distributed data set are found one standard deviation either side of the mean, roughly 95% within two standard deviations, and 99.7% within three. However, it is more complex to work out than the range, and is less helpful in understanding data that is not normally distributed.
You might also like
Research Methods - Descriptive Statistics
Quizzes & Activities
A Level Psychology Topic Quiz - Research Methods
Quizzes & Activities