Study Notes
Mean, Median and Mode
- Level:
- AS, A-Level
- Board:
- AQA, Edexcel, OCR, IB
Last updated 22 Mar 2021
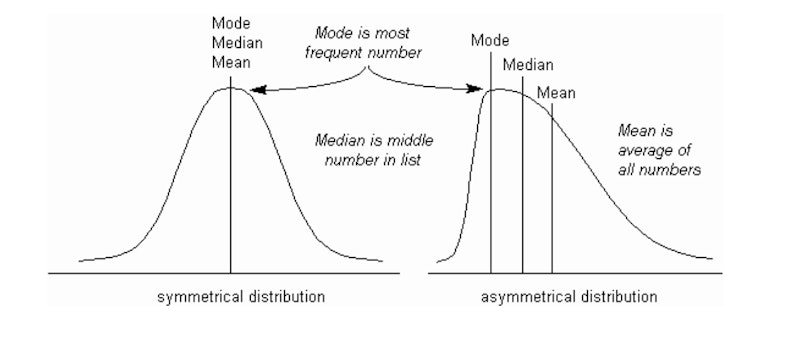
The mean, median and mode are known as measures of centrality: an attempt to identify the midpoint in a data set.
Each does this in a slightly different way and may give a different answer if the data set is a skewed (asymmetrical) distribution (see diagram below).
Mean : The sum of all the data divided by the number of data sets
Example: 8 + 7 + 3 + 9 + 11 + 4 = 42 ÷ 6 = Mean of 7.0
Median : The mid data point in a data series organised in sequence
Example : 2 5 7 8 11 14 18 21 22 25 29 (five data values either side)
Mode : The most frequently occurring data value in a series
Example : 2 2 4 4 4 7 9 9 9 9 12 12 13 ( ‘9’ occurs four times, so is the ‘mode’)
Why are different methods used?
The choice of measure of centrality depends on the task being carried out. Whilst the Mean daily temperature during a particular month may indicate the average for ease of comparison with other months, the Mode would indicate the most frequently experienced daily temperature throughout the month.
When looking at measures of wealth in a country’s population, using the Median is more likely to indicate a figure earned by the actual majority of people rather than the Mean – which may be higher than most people experience if a small proportion of people earn an exceedingly high income.
In Measures of Dispersion the Median is used when calculating Interquartile Range, whilst the Mean is used when calculating Standard Deviation.
You might also like
Interquartile Range (IQR)
Study Notes

A-level Geography: Quantitative Skills Halloween Quiz
9th October 2023