Study Notes
Critical Path Analysis
- Level:
- AS, A-Level
- Board:
- AQA, Edexcel, OCR, IB
Last updated 22 Mar 2021
Critical path analysis ("CPA") is a widely-used project management tool that uses network analysis to help project managers to handle complex and time-sensitive operations.
Introduction
Many larger businesses get involved in projects that are complex and involve significant investment and risk. As the complexity and risk increases it becomes even more necessary to identify the relationships between the activities involved and to work out the most efficient way of completing the project.
The essential technique for using CPA is to construct a model of the project that includes the following:
- A list of all activities required to complete the project
- The time (duration) that each activity will take to completion
- The dependencies between the activities
Using this information, CPA calculates:
- The longest path of planned activities to the end of the project
- The earliest and latest that each activity can start and finish without making the project longer
This process determines which activities are "critical" (i.e., on the longest path) and which have "total float" (i.e. can be delayed without making the project longer).
In project management, a critical path is:
The sequence of project activities which add up to the longest overall duration
The critical path determines the shortest time possible to complete the project.
Any delay of an activity on the critical path directly impacts the planned project completion date (i.e. there is no float on the critical path).
Illustration of CPA
Here is worked example to illustrate how the critical path for a project is determined.
Conventions in drawing the network
The main components of a network analysis are summarised below:
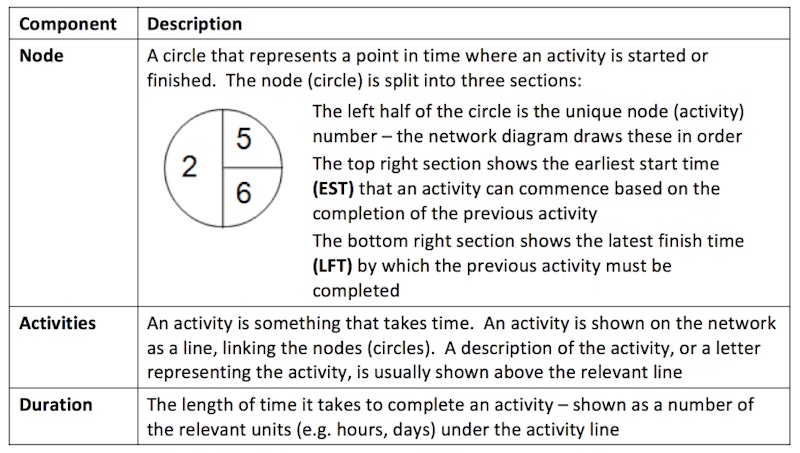
Example network diagram
Consider the following series of activities in a business planning to launch a new product:

Laid out in the correct sequence of activities, the network diagram would look like this before we calculate the EST and LFT for each activity:

The next step is to calculate the EST for each activity.
For example:
The EST for task B is 2 months – the time taken to conduct market research (task A)
To calculate the EST for task C, we add the 2 months for task A to the 4 months for designing the product concept (task B) = 6 months
The remaining ESTs can then be added to the network diagram:
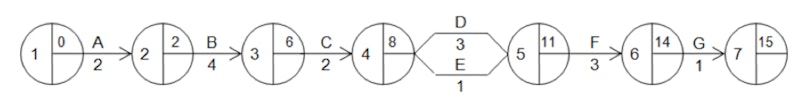
The LFTs show the latest time an activity must be completed by to avoid a delay to the project. LFTs are calculated by looking right to left on the network diagram. So:

Evaluating CPA
The main advantages and disadvantages of a business using CPA can be summarised as follows:
Advantages of CPA
- Most importantly – helps reduce the risk and costs of complex projects
- Encourages careful assessment of the requirements of each activity in a project
- Help spot which activities have some slack ("float") and could therefore transfer some resources = better allocation of resources
- A decision-making tool and a planning tool – all in one!
- Provides managers with a useful overview of a complex project
- Links well with other aspects of business planning, including cash flow forecasting and budgeting
Disadvantages of CPA
- Reliability of CPA largely based on accurate estimates and assumptions made
- CPA does not guarantee the success of a project – that still needs to be managed properly
- Resources may not actually be as flexible as management hope when they come to address the network float
- Too many activities may the network diagram too complicated. Activities might themselves have to be broken down into mini-projects
You might also like
Marketing the budget hotel concept
3rd July 2013
Lean Production (Introduction)
Study Notes
Time-based management
Study Notes
Simultaneous engineering
Study Notes
Cell production
Study Notes
Just in time (“JIT”)
Study Notes
Kaizen
Study Notes
Lean Production Revision Quiz
Quizzes & Activities